長期・短期の移動平均が2本あった際、両方の移動平均の方向がそろった場合、取引したいとします。それが本当に効果があるかどうか含めて検討する為にもインジケーターとして実装して、実際のグラフと比較してどうだろ?考え方足りていないか?などを検討できます。
今回は、移動平均がどちらの方向に移動中かのグラフを2本引きます。両方ともに+or-になった際、取引を開始するという事を考えます。
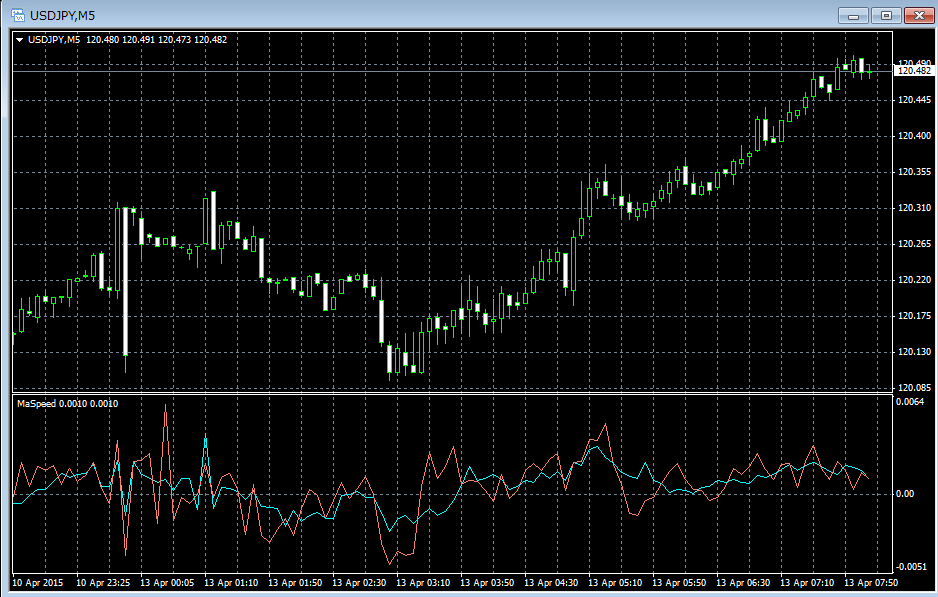
先に結果から。下側の子ウィンドウが移動平均線の移動速度です。移動速度が両方+Or-になったということは中央の0の線を両方超えた場合という風にとらえることができます。
チャート右側の長期にトレンドが出ている場合は、有効ですが、左側のチャートが暴れている箇所は、だましとなるシグナルが上下に複数発生している事が見て取れます。
移動平均の方向だけを見て取引をするのは危険ということがわかりました。(^^;;;;
今まで使用してきた関数などを使用してコードを作成しました。新しいことは特にしていないため、今回はコードの解説とばします^^;;
ちなみに、移動平均の種類をEMAやWMAにしたり、平均期間を変えたりすると、また違ったグラフになります。興味のある方はいろいろ試してみてください。もしいい感じのパラメータが見つかったら教えていただけるととてもうれしいです(^^ 個人的には、EMA長期12、短期5でぐらいだともしかして、5分足の判断の一つとして使えるかも?とか思ってたり・・・。
//------------------------------------------------------------------
// 移動平均速度オシレーター
#property copyright "Copyright 2015,  Daisuke"
#property link      "http://mt4program.blogspot.jp/"
#property version   "1.00"
#property strict

//indicator_separate_windowを指定すると、子ウィンドウを追加する動作
#property indicator_separate_window

//バッファーを指定する。
#property indicator_buffers 2

//プロット数を指定する。
#property indicator_plots   2

//長期移動平均速度
#property indicator_label1  "SpeedLong"
#property indicator_type1   DRAW_LINE
#property indicator_color1  clrAqua
#property indicator_style1  STYLE_SOLID
#property indicator_width1  1

//短期移動平均速度
#property indicator_label2  "SpeedShort"
#property indicator_type2   DRAW_LINE
#property indicator_color2  clrIndianRed
#property indicator_style2  STYLE_SOLID
#property indicator_width2  1

//入力パラメータ 長期期間
input int   LongPeriod = 10;

//入力パラメータ 短期期間
input int   ShortPeriod = 5;

//入力パラメータ 表示移動
input int   MaShift = 0;

//入力パラメータ 移動平均種別
input ENUM_MA_METHOD MaMethod = MODE_SMA;

//入力パラメータ 適用価格
input ENUM_APPLIED_PRICE MaPrice = PRICE_CLOSE;

//インジケーター バッファ
double         longValues[];
double         shortValues[];

//------------------------------------------------------------------
//初期化
int OnInit()
{
//インジケーターバッファを初期化する。
SetIndexBuffer(0,longValues);
SetIndexBuffer(1,shortValues);
return(INIT_SUCCEEDED);
}
//+------------------------------------------------------------------+
//| Custom indicator iteration function                              |
//+------------------------------------------------------------------+
int OnCalculate(const int rates_total,
const int prev_calculated,
const datetime &time[],
const double &open[],
const double &high[],
const double &low[],
const double &close[],
const long &tick_volume[],
const long &volume[],
const int &spread[])
{

//現在チャートの選択時間幅を秒で取得する。
int period = PeriodSeconds(PERIOD_CURRENT) / 60;

//元となる値を計算する。
for( int i = (rates_total - prev_calculated - 1); i>=0 ; i-- )
{
// 最も古い要素は速度算出不可
if( i == (rates_total - 1) )
{
shortValues[i] = 0 ;
longValues[i] = 0 ;
continue;
}
// 現在の価格
double currentPrice = iMA(Symbol(), 0, LongPeriod, MaShift, MaMethod, MaPrice, i);
// ひとつ前の価格
double beforePrice = iMA(Symbol(), 0, LongPeriod, MaShift, MaMethod, MaPrice, i + 1);

//単位がチャート上の通貨ではない単位(この場合 通貨/分)の値を入れる。
longValues[i] = (currentPrice - beforePrice) / period;

// 現在の価格
currentPrice = iMA(Symbol(), 0, ShortPeriod, MaShift, MaMethod, MaPrice, i);
// ひとつ前の価格
beforePrice = iMA(Symbol(), 0, ShortPeriod, MaShift, MaMethod, MaPrice, i + 1);

//単位がチャート上の通貨ではない単位(この場合 通貨/分)の値を入れる。
shortValues[i] = (currentPrice - beforePrice) / period;
}
return(rates_total);
}