やり方はいくつかあると思うのですが、ここではヒストグラムを使った雲の描画をまず行いたいと思います。
サブウィンドウ上でのヒストグラムは、0を起点として描かれますが、チャート上では少し特殊な仕様となります。
まず、二つのバッファがセットになります。#property定義では奇数-偶数というセットになります。
例えばこんな感じです。
#property indicator_label1  "UP"
#property indicator_type1   DRAW_HISTOGRAM
#property indicator_color1  clrAqua
#property indicator_style1  STYLE_DOT
#property indicator_width1  1

#property indicator_label2  "DOWN"
#property indicator_type2   DRAW_HISTOGRAM
#property indicator_color2  clrIndianRed
#property indicator_style2  STYLE_DOT
#property indicator_width2  1
実際のバッファ指定ではバッファインデックス偶数-奇数のセットとなります。
int OnInit()
{
// ヒストグラムを描画する場合二つのバッファがセットになる。
// 必ず、偶数-奇数のペアにする。
// up[i] > down[i]の場合、バッファ0側の色(clrAqua)が使われ
// down[i] > up[i]の場合、バッファ1側の色(clrIndianRed)が使われる
SetIndexBuffer(0,up);
SetIndexBuffer(1,down);
このとき、描画されるスタイルやカラーは値が大きいほうが採用されます。
上記例の場合
up[i] > down[i]の時はindicator_color1で指定されているclrAquaが、
up[i] < down[i]の時はindicator_color2で指定されているclrIndianRedが使用されます。
up[i] == down[i]の時には描画されません。
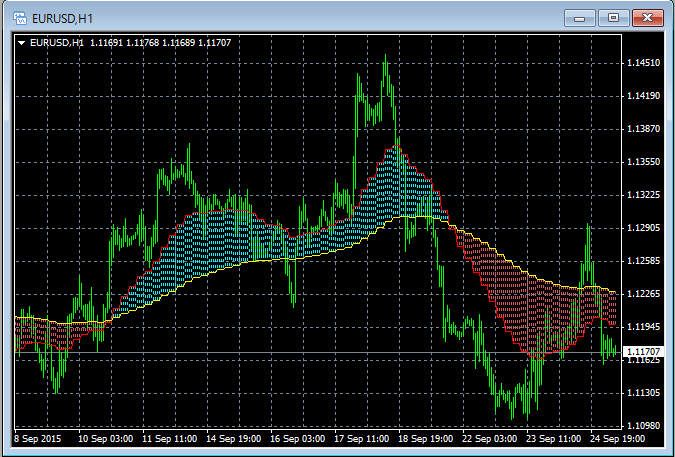
ということで、試しに二つの移動平均間をヒストグラムで結ぶプログラムを書いてみました。雲の形は階層状になっていたほうがそれっぽいなぁと思い、上位時間足の移動平均をもとに描画するようになっています。
FX-ONブログランキングにご協力よろしくお願いいたしますm(_ _ )m
//------------------------------------------------------------------
// 二つの移動平均の間をヒストグラムで結ぶ
#property copyright "Copyright 2015,  Daisuke"
#property link      "http://mt4program.blogspot.jp/"
#property version   "1.00"
#property strict
#property indicator_chart_window

//バッファーを指定する。
#property indicator_buffers 4

//プロット数を指定する。
#property indicator_plots   4

#property indicator_label1  "UP"
#property indicator_type1   DRAW_HISTOGRAM
#property indicator_color1  clrAqua
#property indicator_style1  STYLE_DOT
#property indicator_width1  1

#property indicator_label2  "DOWN"
#property indicator_type2   DRAW_HISTOGRAM
#property indicator_color2  clrIndianRed
#property indicator_style2  STYLE_DOT
#property indicator_width2  1

#property indicator_label3  "MA1"
#property indicator_type3   DRAW_LINE
#property indicator_color3  clrRed
#property indicator_style3  STYLE_SOLID
#property indicator_width3  1

#property indicator_label4  "MA2"
#property indicator_type4   DRAW_LINE
#property indicator_color4  clrYellow
#property indicator_style4  STYLE_SOLID
#property indicator_width4  1

// 対象タイムフレーム
extern ENUM_TIMEFRAMES TargetPeriod = PERIOD_H4;

// 入力パラメータ 移動平均1期間
extern int Ma1Period = 11;

//入力パラメータ 移動平均1種別
extern ENUM_MA_METHOD Ma1Method = MODE_EMA;

// 入力パラメータ 移動平均2期間
extern int Ma2Period = 48;

//入力パラメータ 移動平均2種別
extern ENUM_MA_METHOD Ma2Method = MODE_EMA;

//入力パラメータ 表示移動
extern int   MaShift = 0;

//入力パラメータ 適用価格
extern ENUM_APPLIED_PRICE MaPrice = PRICE_MEDIAN;

//バッファー
double up[];
double down[];
double ma1[];
double ma2[];

//------------------------------------------------------------------
//初期化
int OnInit()
{
// ヒストグラムを描画する場合二つのバッファがセットになる。
// 必ず、偶数-奇数のペアにする。
// up[i] > down[i]の場合、バッファ0側の色(clrAqua)が使われ
// down[i] > up[i]の場合、バッファ1側の色(clrIndianRed)が使われる
SetIndexBuffer(0,up);
SetIndexBuffer(1,down);

SetIndexBuffer(2,ma1);
SetIndexBuffer(3,ma2);

int maxPeriod = (int)MathMax(Ma1Period, Ma2Period);

SetIndexDrawBegin(0, maxPeriod);
SetIndexDrawBegin(1, maxPeriod);
SetIndexDrawBegin(2, maxPeriod);
SetIndexDrawBegin(3, maxPeriod);

string short_name = "cloud";
IndicatorShortName(short_name);

return(INIT_SUCCEEDED);
}


//------------------------------------------------------------------
//計算イベント
int OnCalculate(const int rates_total,          //各レート要素数
const int prev_calculated,      //計算済み要素数
const datetime &time[],         //要素ごとの時間配列
const double &open[],           //オープン価格配列
const double &high[],           //高値配列
const double &low[],            //安値配列
const double &close[],          //クローズ価格配列
const long &tick_volume[],      //ティック数(要素の更新回数)
const long &volume[],           //実ボリューム(?)
const int &spread[])            //スプレット
{
if( Period() > TargetPeriod ) return rates_total ;

for( int i = (rates_total - prev_calculated - 1); i >= 0 && !IsStopped(); i-- )
{
int shift = iBarShift(NULL, TargetPeriod, time[i], false);

ma1[i] = iMA(NULL, TargetPeriod, Ma1Period, MaShift, Ma1Method, MaPrice, shift);
ma2[i] = iMA(NULL, TargetPeriod, Ma2Period, MaShift, Ma2Method, MaPrice, shift);

//ma1 > ma2の場合clrAqua ma1 < ma2の場合はclrIndianRed
up[i] = ma1[i];
down[i] = ma2[i];
}
//元となる値を計算する。
return(rates_total - 1);
}