■15分足に、1時間足の10EMA
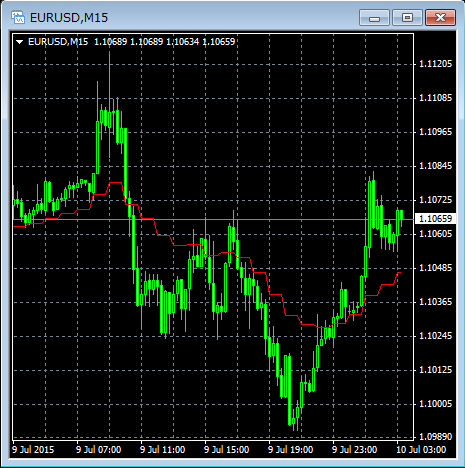
細かい時間足に、上の時間足の移動平均を出すプログラムです。
意味合い的には、たとえば、クローズ値ベースで足を書くと、その時間に値動きが無視されます。そのため、一種のノイズフィルタとして働きます。
あと、時間足や日足の良く使用される単純移動平均が心理的抵抗線になることがありますので、下位の足に描画しておくと抵抗線付近での値動きに注意ができます。
■15分足での1時間足10EMAと15分足40EMAの違い
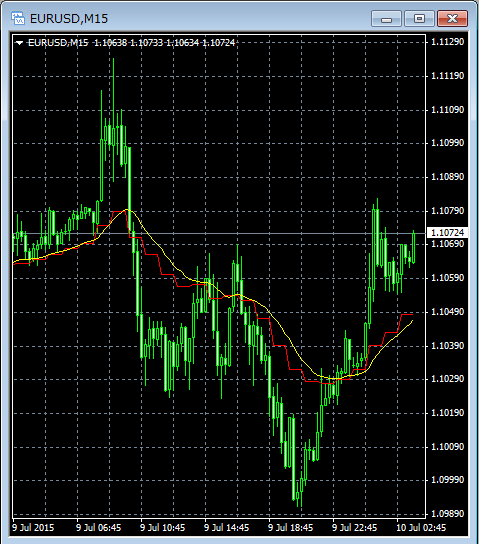
・・・・・。まぁ好みの問題かもしれません^^;;
宣伝を。昨日のEURUSDは、トレンド強度オシレータがばっちり働きました。
トレンド・周期解析を組み合わせて相場を制する!

予測移動平均の方は、逆張りは2勝1敗となりました。
ボリンジャーバンドの欠点を解決する! 高追従型ボリンジャーバンド

価格の行き過ぎ、トレンド、周期を確認して相場を制するセット

周期分析も珍しく的中してました^^;;;
周期分析の方は世の中に出せるレベルまで精度を上げることができないため、トレンド強度のおまけとしてセット販売することにしました。トレンド強度単品と値段は変わりませんので、セットでお買い求めください。
7/9の予測移動平均ボリンジャーバンドとトレンド強度
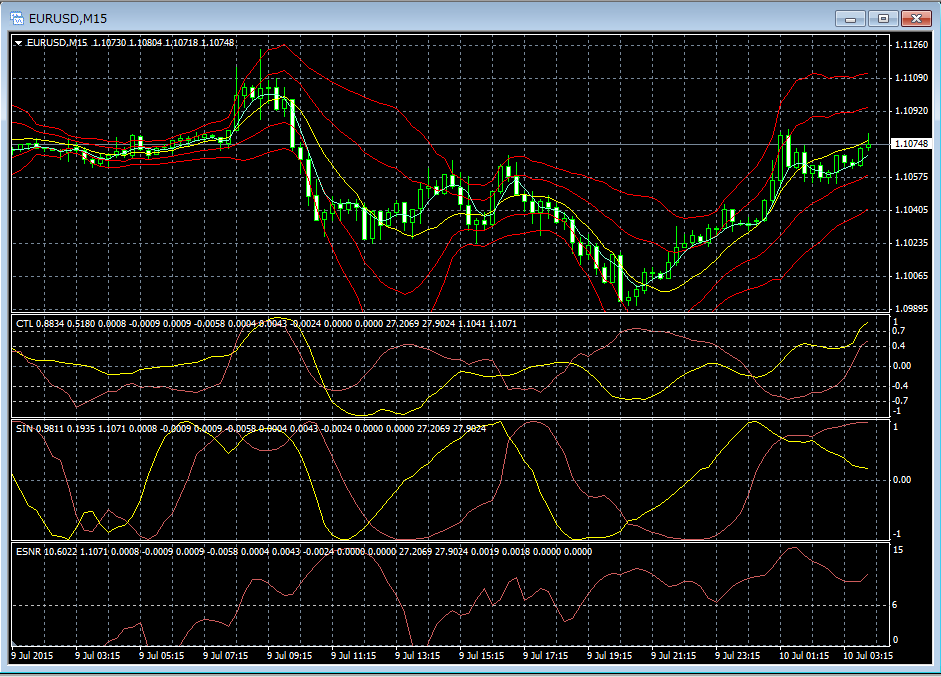
※下二つは、周期分析と周期分析の信頼性オシレータです。
プログラムはこちらから。
//+------------------------------------------------------------------+
//|                                                MyOtherTimeMA.mq4 |
//|                                                           Heecho |
//|                                             https://www.mql5.com |
//+------------------------------------------------------------------+
#property copyright "Heecho"
#property link      "https://www.mql5.com"
#property version   "1.00"
#property strict
#property indicator_chart_window

// バッファーを指定する。
#property indicator_buffers 1

// プロット数を指定する。
#property indicator_plots 1

#property indicator_label1  "OtherTimeMA"
#property indicator_type1   DRAW_LINE
#property indicator_color1  clrRed
#property indicator_style1  STYLE_SOLID
#property indicator_width1  1

// 他時間の移動平均線
double ma[];

input ENUM_TIMEFRAMES MATimeframe = PERIOD_H1;

// 他時間の移動平均線のタイプ
input ENUM_MA_METHOD MAType = MODE_EMA;

// 他時間の価格種別
input ENUM_APPLIED_PRICE MAPrice = PRICE_CLOSE;

// 他時間の移動平均線を求めるバーの数
input int MAPeriod = 10;


//+------------------------------------------------------------------+
//| Custom indicator initialization function                         |
//+------------------------------------------------------------------+
int OnInit()
{
if ( MAPeriod <= 0 )
{
return INIT_PARAMETERS_INCORRECT;
}

SetIndexBuffer( 0, ma );
IndicatorShortName( "OtherTimeMA" );

return INIT_SUCCEEDED;
}

//+------------------------------------------------------------------+
//| Custom indicator iteration function                              |
//+------------------------------------------------------------------+
int OnCalculate
( const int rates_total       // バーの総数
, const int prev_calculated   // 計算済みのバーの数
, const datetime& time[]      // バーの開始時刻の配列
, const double& open[]        // バーの始値の配列
, const double& high[]        // バーの高値の配列
, const double& low[]         // バーの安値の配列
, const double& close[]       // バーの終値の配列
, const long& tick_volume[]   // バーのティック数(要素の更新回数)の配列
, const long& volume[]        // バーの出来高の配列
, const int& spread[]         // バーのスプレットの配列
)
{
int period = Period();
if ( period > MATimeframe )
{
return rates_total;
}

for ( int i = rates_total - prev_calculated - 1; i >= 0; i-- )
{
int index = iBarShift( NULL, MATimeframe, time[ i ] );
double val = iMA( NULL, MATimeframe, MAPeriod, 0, MAType, MAPrice, index );
if ( val != ma[ i ] )
{
ma[ i ] = val;
for ( int j = 1; 1; j++ )
{
if ( i + j >= rates_total )
{
break;
}
int index2 = iBarShift( NULL, MATimeframe, time[ i + j ] );
if ( index != index2 )
{
break;
}
ma[ i + j ] = val;
}
}
}

return rates_total - 1;
}